Is Bitcoin’s ‘buy signal’ actually a sign of decline? Bitfinex long positions reach highest since 2023
Historically, price declines repeat every time long positions increase... Acts as a market contrarian indicator

- •Bitfinex BTC long positions reached 79,343, the highest since November 2023.
- •Historically, Bitcoin prices have shown a contrarian pattern of falling whenever long positions surge.
- •Combined with macroeconomic uncertainty, the possibility of a further decline in Bitcoin is being weighed.
Bitfinex long positions reach highest level since November 2023
Bitcoin (BTC) long positions on Bitfinex, an exchange with a long history in the cryptocurrency market, reached 79,343, breaking the highest since November 2023. A long position refers to a buying position that bets on price rises, and usually indicates the growing optimism of market participants.
However, industry officials are paying attention to the history of this indicator acting as a 'contrary indicator'. This is because whenever long positions increase rapidly, the price of Bitcoin has shown a downward trend.
Why do bullish signals lead to bearish ones?
In general, an increase in long positions is interpreted as a positive signal that upward pressure is increasing. However, Bitfinex data has shown the opposite pattern.
As a representative example, long positions surged 30% in the fourth quarter of 2025, but the spot price of Bitcoin fell 23% during the same period, pushing it to $87,550. Conversely, Bitcoin tended to form a high point when long positions bottomed out (such as in October 2024).
Market analysts explain this phenomenon with the investment maxim, “The crowd is usually wrong.” The logic is that when the majority falls into optimism, reverse betting is actually effective.
‘Reverse indicator’ pattern repeated from 2022
The inverse correlation between Bitfinex long positions and Bitcoin price has been consistently observed in recent years. From the cryptocurrency market collapse in 2022, the rebound in 2024, and the adjustment period in 2025, the peak of long positions has been aligned with the price trough, and the bottom of long positions has been aligned with the price peak.
This phenomenon is attracting more attention because it occurs despite the fact that Bitfinex is an exchange with a higher proportion of institutional and professional traders than individual investors. It is analyzed that structural factors that amplify price fluctuations due to liquidation pressure due to the large number of positions using leverage are also at play.
Future outlook [AI analysis]
If the recent surge in long positions follows past patterns, it seems highly likely that Bitcoin, which is currently trading sideways in the $65,000 to $75,000 range, will break away to the downside. Bitcoin has continued its downward trend since surpassing $100,000 last year.
The macroeconomic environment is also giving strength to the bearish theory. According to multiple foreign media, the possibility of U.S. intervention in the Iran war, oil price shocks, and concerns about interest rate hikes by the U.S. Federal Reserve (Fed) are stimulating risk-asset aversion.
However, it is important to keep in mind that past patterns do not guarantee future results. Other variables such as Bitcoin spot exchange-traded fund (ETF) fund flow, institutional investor trends, and changes in the regulatory environment can also affect the price, so a comprehensive judgment is necessary.
댓글 (3)
Is 관련 기사 잘 읽었습니다. 유익한 정보네요.
Bitcoin’s에 대해 더 알고 싶어졌습니다. 후속 기사 부탁드립니다.
좋은 의견이십니다.
More in Economy

Strategy, has Bitcoin buying streak stopped for 13 consecutive weeks?

Both cryptocurrency and banking industries are dissatisfied with the U.S. stablecoin profit regulation plan.

US CLARITY Act could shake up the DeFi ecosystem by banning stablecoin profits

The possibility of a Federal Reserve interest rate hike soars to 30%... Bitcoin market impact

Ethereum launches ‘special economic zone’ project to solve fragmentation problem

XRP, holding on to the $1.33 support line... Soaring leverage and selling pressure coexist
Latest News

Oh Se-hoon: "I Would Choose 5th Term as Seoul Mayor Over Presidency"
Seoul Mayor Oh Se-hoon states he would choose 5th mayoral term over presidency
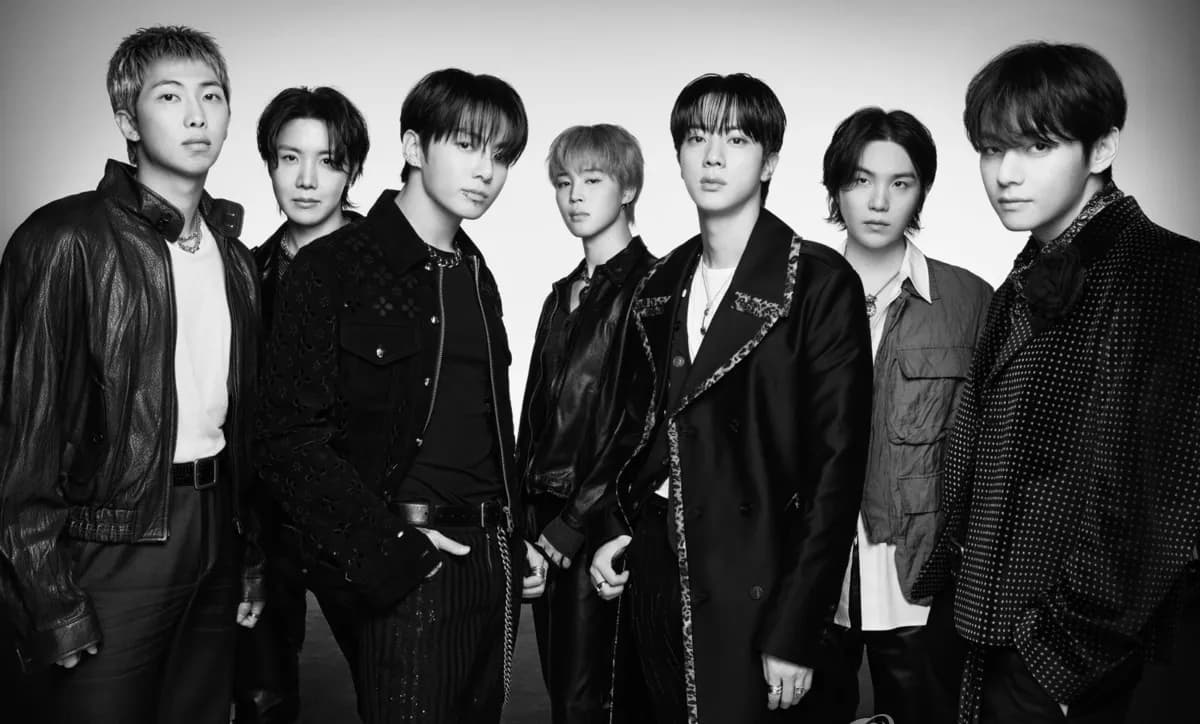
BTS' 'Arirang' Tops Billboard 200 Chart—Seventh No. 1 Album
BTS's new song 'Arirang' achieves No. 1 on U.S. Billboard 200 chart
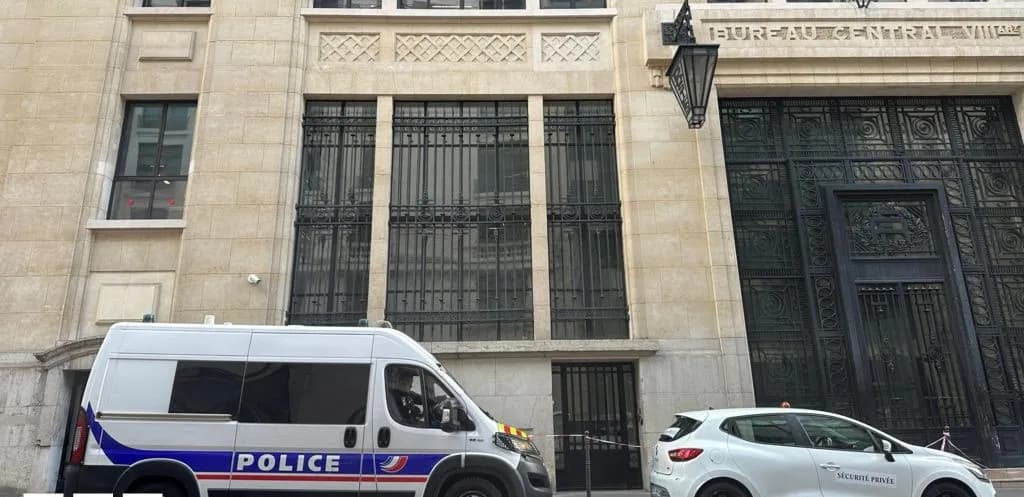
Three Arrested in Paris After Attempted Bomb Attack Near Bank of America
Three suspects arrested after attempted bomb attack near Bank of America branch in Paris

Three Journalists Killed in Israeli Strike on Southern Lebanon, Hundreds Mourn in Beirut
Three journalists killed in Israeli targeted attack on southern Lebanon
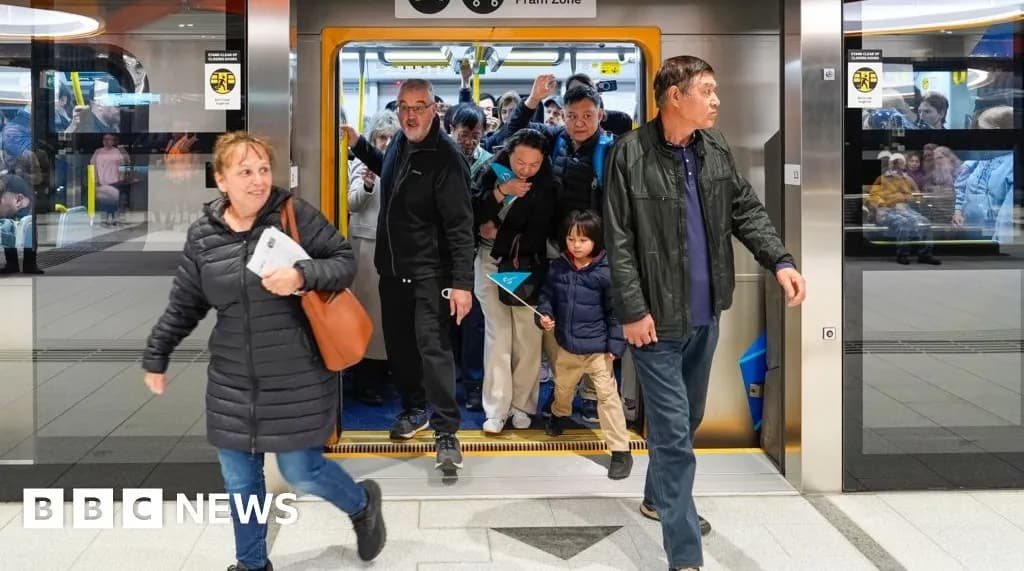
Two Australian States Offer Free Public Transport as Iran War Drives Up Fuel Prices
Victoria and Tasmania implement free public transport in response to fuel price surge from Iran war fallout

Iranian Missile Strikes Israeli Industrial Zone—Major Fire and Hazardous Material Leak
Iranian ballistic missile directly hits southern Israeli industrial zone, causing major fire
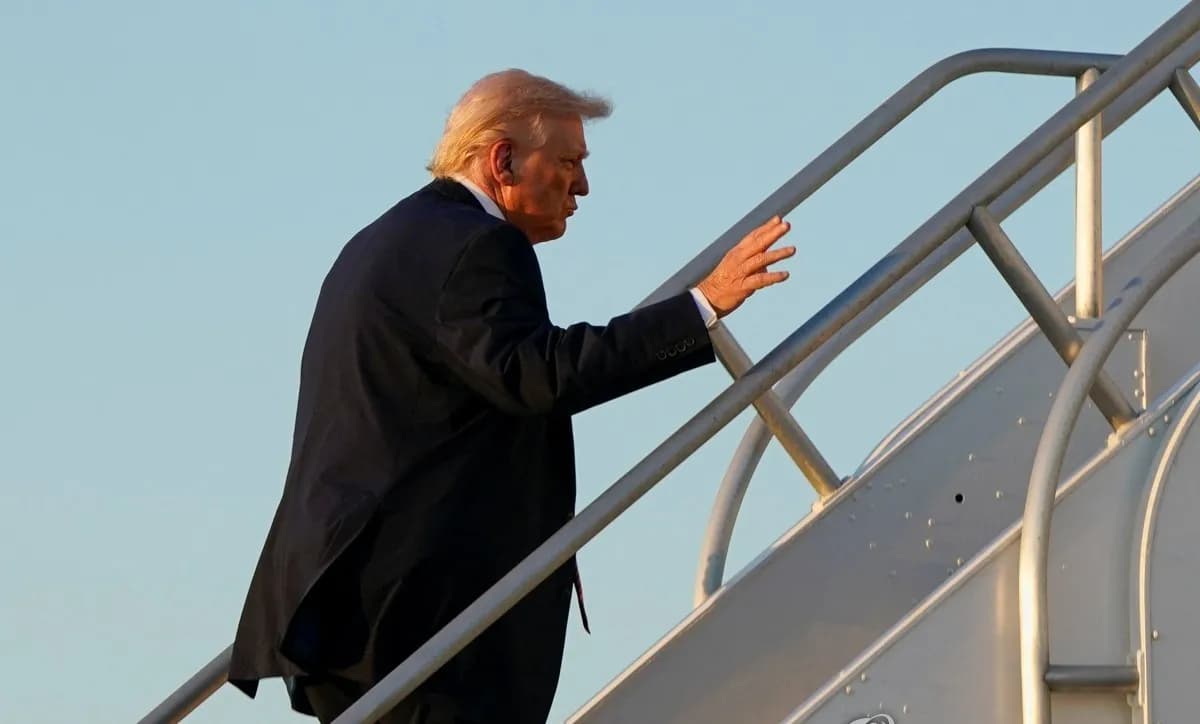
Trump Shares Pastor's Letter Amid Month-Long Iran War: "Blessed Are the Peacemakers"
President Trump shares pastor's letter on one-month anniversary of Iran war
African Football Chief Resigns Amid Morocco-Senegal Final Controversy
CAF Secretary General Veron Mosengo-Omba resigns amid Morocco-Senegal final controversy